What purpose ?
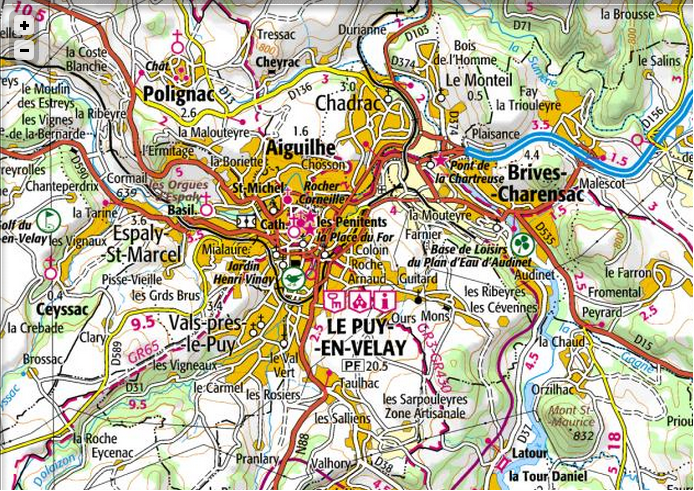
Ideally, unless living in Lapland, we should not be bothered that much about maps projections ! Unfortunately, in practice, there are a few contexts in which you simply can't avoid braving them. For example, if you must show a raster layer with texts, and don't control its production.
Reprojected pictures loose sharpness ! Your map may have to support the original local projection.
Let's see what Leaflet offers on this matter...
Configuring the map
My knowledge about local projections machinery is (very) light !
I could demystify a couple of concepts with, among others, Tom Mac Wright's educational articles and tools, or Kartena's article on Leaflet.
Nevertheless, the whole thing is pretty straightforward to setup, especially when you look at Bjorn Sandvik's working example !
Download Leaflet, Proj4js and Proj4Leaflet, and fasten your seat belt !
<link rel="stylesheet" href="leaflet.css" />
<script src="js/leaflet.js"></script>
<script src="js/proj4js-compressed.js"></script>
<script src="js/proj4leaflet.js"></script>
Your layer characterics :
// Your source tile layer extent, expressed in local projection
var bbox = [700000, 6325197, 1060000, 6617738];

// Maximum resolution in meters per pixel (largest area side / tile size).
var maxResolution = 1406.25;

// Scale for each level
var scale = function(zoom) {
        return 1 / (maxResolution / Math.pow(2, zoom));
};

// Coordinate to grid transformation matrix
var transformation = new L.Transformation(1, -bbox[0], -1, bbox[3]);
Assemble in Leaflet :
// Official Spatial Reference from http://www.spatialreference.org/ref/epsg/2154/
var crs = L.CRS.proj4js('EPSG:2154',
                        '+proj=lcc +lat_1=49 +lat_2=44 +lat_0=46.5 +lon_0=3 +x_0=700000 +y_0=6600000 +ellps=GRS80 +towgs84=0,0,0,0,0,0,0 +units=m +no_defs',
                        transformation);
crs.scale = scale; // required by Leaflet 0.4

// Location of tiles (see next paragraph)
var ignLayer = new L.TileLayer('http://localhost:8080/1.0.0/ign/{z}/{x}/{y}.png', {
    continuousWorld: true,  // very important
});

map = new L.Map('map', {
    crs: crs,
    scale: scale,
    continuousWorld: true,  // very important
    layers: [ignLayer,]
    // Initial view
    center: new L.LatLng(44.65, 6.12), // Universal Lat/Lng
    zoom: 5,
});
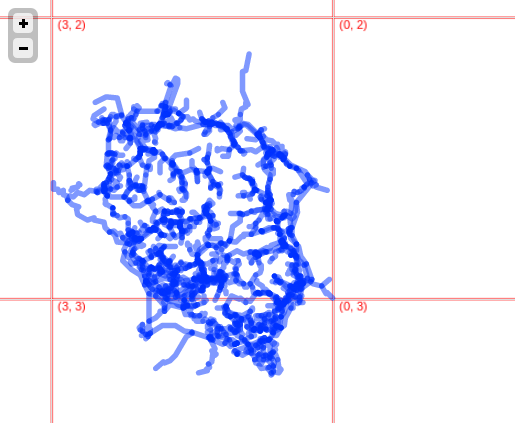
kokoni suggests to use an overlay layer to debug tile numbering :
var canvasTiles = L.tileLayer.canvas();
 canvasTiles.drawTile = function(canvas, tilePoint, zoom) {
     var ctx = canvas.getContext('2d');
     ctx.strokeStyle = ctx.fillStyle = "red";
     ctx.rect(0,0, 256,256);
     ctx.stroke();
     ctx.fillText('(' + tilePoint.x + ', ' + tilePoint.y + ')',5,10);
 });
 map.addLayer(canvasTiles);
Serve the tiles from a WMS
Adapt with the bbox and maxesolution, as in the map, and save this configuration to tilecache.cfg. It also assumes to match the scale we chose above (divided by 2 at each level) :
[ign]
type=WMSLayer
layers=scan100,scan25
url=http://server.carto.fr/wms?
extension=jpg
tms_type=google
srs=EPSG:2154
bbox=700000,6325197,1060000,6617738
maxResolution=1142.7383

[cache]
type=GoogleDisk
base=/tmp/
In order to run this configuration, just install :
virtualenv .
source bin/activate
pip install TileCache
pip install Paste
And either run it locally with tilecache_http_server.py or tile the pyramid once with tilecache_seed.py ign 0 10.
Finally, adjust the tile url in your map config !
First impressions...
It works !
A couple of things seem implicit, and Leaflet feels a bit fragile with this. Changing a value somewhere might break an hidden assumption somewhere else.
Also, the documentation can be misleading : it says to set continuousWorld to true for things that don't represent the world :)
We'll try to push Leaflet limits in the next days at Makina Corpus, especially 0.4 branch, we'll keep posting if we face anything worth sharing :)
#leaflet, #gis, #javascript - Posted in the Dev category