A short introduction to web mapping with Django, using two very simple applications: django-leaflet and django-geojson, by Makina Corpus.
We will build a map with all major weather stations of the world.
Weather stations
Each weather station has an id, a name and a position.
As a GeoDjango model, it becomes :
# models.py
from django.db import models
from django.contrib.gis.db import models as gismodels


class WeatherStation(gismodels.Model):

    wmoid = models.IntegerField(primary_key=True)
    name = models.CharField(max_length=256)

    geom = gismodels.PointField()

    objects = gismodels.GeoManager()

    def __unicode__(self):
        return self.name
Loading actual data
The World Meteorological Organization publishes a list of all major weather stations, in a CSV format.
Unfortunately, this format is not very friendly (especially latitudes and longitudes) :
StationId   StationName         Latitude    Longitude ...
60351       JIJEL- ACHOUAT      36 48 00N   05 53 00E
...
07630       TOULOUSE BLAGNAC    43 37 16N   01 22 44E
...
We will convert coordinates from degres minutes seconds to decimal degrees:
def dms2dec(value):
    """
    Degres Minutes Seconds to Decimal degres
    """
    degres, minutes, seconds = value.split()
    seconds, direction = seconds[:-1], seconds[-1]
    dec = float(degres) + float(minutes)/60 + float(seconds)/3600
    if direction in ('S', 'W'):
        return -dec
    return dec
And create an instance of our model for each entry in the CSV :
import csv
from django.contrib.gis.geos import Point

from webmap.models import WeatherStation


csv_file = 'Pub9volA130819x.flatfile.txt'

reader = csv.DictReader(open(csv_file, 'rb'), delimiter="\t")
for line in reader:
    lng = dms2dec(line.pop('Longitude'))
    lat = dms2dec(line.pop('Latitude'))
    wmoid = int(line.pop('StationId'))
    name = line.pop('StationName').title()

    WeatherStation(wmoid=wmoid, name=name, geom=Point(lng, lat)).save()
Now, our table is full of records (~ 12000) !
If you open it with graphical tools like QGis, it's stuffed !
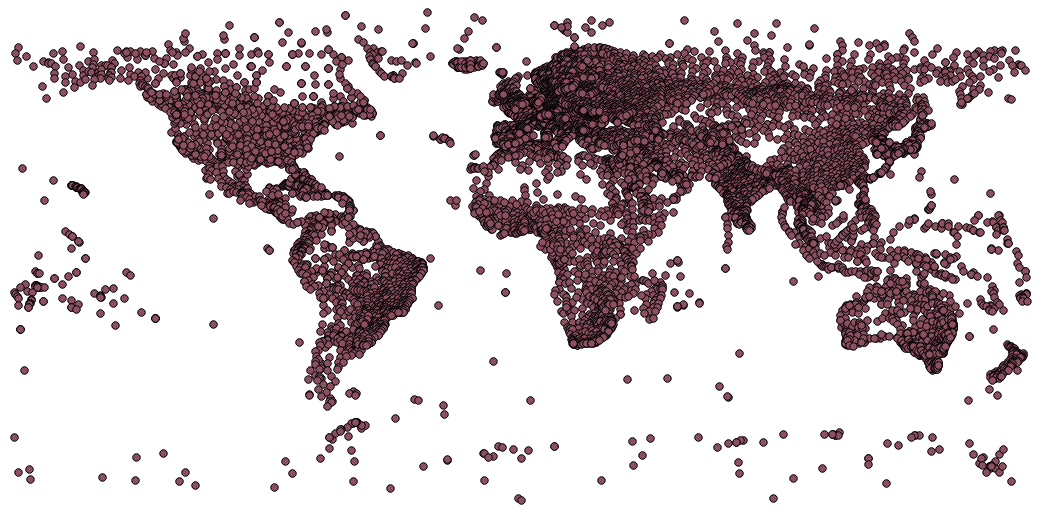
( If you want a script that converts this stations file into GeoJSON, you can use this piece of code)
Plot on map
With django-leaflet, after having added leaflet to your INSTALLED_APPS, you can insert maps in templates :
{% load leaflet_tags %}
<html>
  <head>
    {% leaflet_js %}
    {% leaflet_css %}
  </head>
  <body>
    <h1>Weather Stations</h1>
    {% leaflet_map "main" callback="main_map_init" %}

    <script type="text/javascript">
        function main_map_init (map, options) {
            // Use Leaflet API here
        }
    </script>
  </body>
</html>
A blank map shows up, with a basic OpenStreetMap background.
Vectorial data
We now want to place markers for each weather station. For this, we use django-geojson, which provides a very simple base view :
# urls.py

from djgeojson.views import GeoJSONLayerView

from webmap.models import WeatherStation


urlpatterns = patterns('',
    url(r'^data.geojson$', GeoJSONLayerView.as_view(model=WeatherStation), name='data')
)
We load this data in Ajax, and add it as map layer, in the initialization function left empty in the above snippet :
function main_map_init (map, options) {

    var dataurl = '{% url "data" %}';
    // Download GeoJSON via Ajax
    $.getJSON(dataurl, function (data) {
        // Add GeoJSON layer
        L.geoJson(data).addTo(map);
    });

}
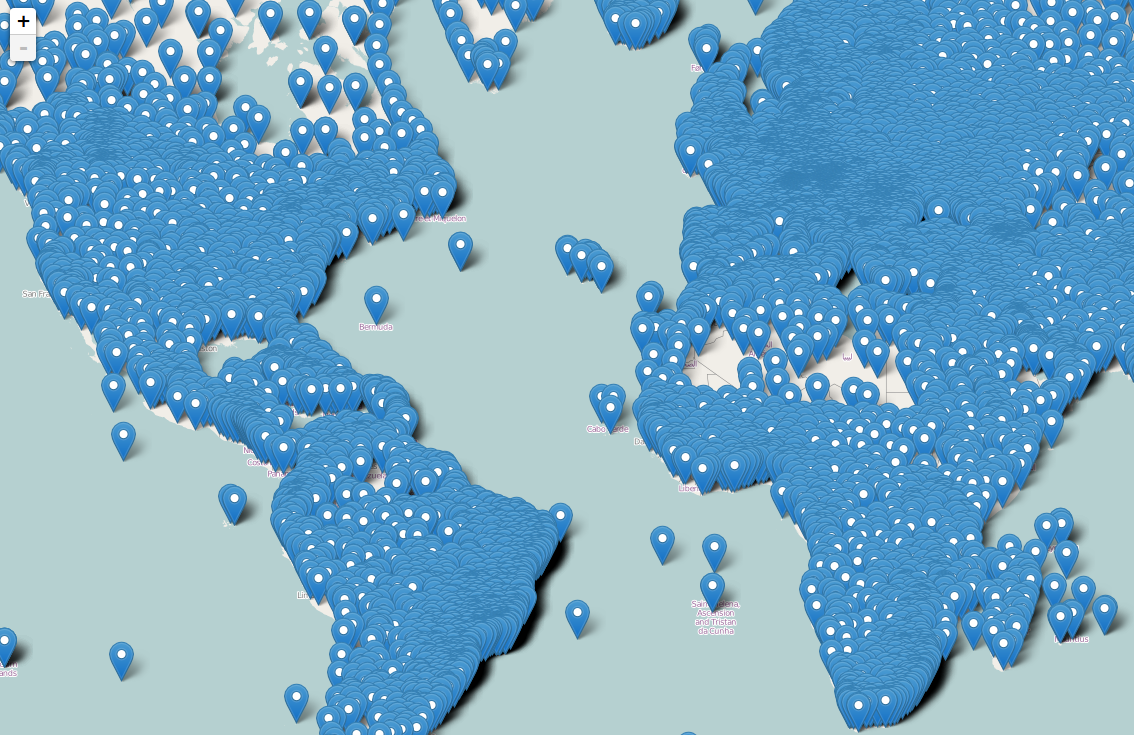
The map shows up, and get filled with weather stations !
Going further...
This was a first introduction, but it applies to all kinds of goemetries (lines, polygons, ...).
I published the full project if you want to start from an example.
If you already feel comfortable with Django, there won't be any surprise : have a look at Leaflet, django-leaflet and django-geojson respective documentations in order to get an idea of the customizations you are offered...
Performance
A map with more than 12 000 HTML objects is not going to be snappy.
Hopefully, it won't be the case for your first applications !
And fortunately, there are plently of different strategies to draw such an amount of data :
- Use marker clusters to reduce the number of elements on the map (see result here) ;
- Draw circles instead of markers and switch to Canvas (see Leaflet documentation) ;
- Use tiled geojson ;
- Render tiles using Tilemill/Mapnik ;
- ...
It gives us a lot of topics to explore and blog about :)
#django, #leaflet, #gis, #geojson - Posted in the Dev category