Most of us are relatively familiar with system monitoring: we monitor RAM, CPU, or disk usage over time and receive alerts when some thresholds are reached.
But the quality of a whole service is rarely defined by the health of a single isolated server. Rather, it is the interactions between the parts that is often the source of problems.
What about the consistency between the CDN cache and the origins? The last run of a scheduled task? Imminent expiration of your SSL certificates? The amount of clients side errors? The latency of critical HTTP endpoints? The number of pending pull-requests on your repositories?
Poucave is a small web app that executes a series of domain specific checks for the parts and their interactions that make up our service.
Where did we start from?
Centuries ago, telescopes helped our ancestors to distinguish a single shining dot from a whole constellation. Yes, that's how far we started from!
We used to consider our service healthy as long as operating system resources were still available and no HTTP 5XX error was served. This idea was implemented by introducing a /__heartbeat__ endpoint on each server, that executes some internal health checks and returns a 200 Ok if everything is fine and a 500 Internal Server Error if something is wrong. We made this a requirement for every deployed application, and were polling this HTTP endpoint from an external alerting service. Operators are paged if it keeps failing for a while.
This served us well. But our service was integrated in a complex ecosystem, and making sure that it was 100% reliable took more than that. We had a CDN, push notifications, some scheduled tasks, data synchronization on clients, etc. Our heartbeat endpoints could be all green, but still, we sometimes had users reporting issues or inconsistencies.
Enhancing the capacities of our heartbeat endpoint would break the separation of concerns. Apart from not being very robust, a system shouldn't be in charge of checking external components that are more related to the way it's deployed than its own functional scope. Concretely, verifying a database connection from the server hearbeart is fine, but not querying the clients Telemetry data.
Discovering issues on your system because some users complain is never a great feeling. And less when subsequent investigations and troubleshooting are taking time and require a lot of knownledge about all sub-systems and their interactions.
We needed to improve our ability to see. See the constellation of systems, instead of just a single one.

What do we need?
We wanted to identify the root cause of incidents as fast as possible. For this, we needed to:
- see our service as whole, with all its sub-parts, including clients;
- document each part and interactions;
- monitor and be alerted on sub-part failures;
- track service reliability over time;
- capitalize knownledge about troubleshooting and past issue resolutions.
Being able to see the problem as a whole would give more insights about the fix. We needed a solution to help us identify the root cause faster, and reassure our users.
In order to include the clients behaviour, we could rely on the company real-time Telemetry platform. A couple of years ago, we unified the way our clients would report uptake Telemetry (success, up-to-date, network-error, certificate-error, etc.), and that is super useful to write generic checks about error rates for multiple different components.
Since some parts of our service are only accesible via our VPN, like the signature infrastructure, an external ping service cannot reach them. This new tool would serve as a bridge between the two.
Not every check has to necessarily be monitored by an alerting service. Some can just be indications for operators, or even never fail and just mash-up information from the underlying sub-parts.
Our solution
No rocket science. The same idea as our heartbeat endpoint but from an independant service, and infinitely extensible.
A simple and stupid HTTP API, no backend, that starts from a configuration file where checks are listed:
[checks.a-project.a-check]
description = "Heartbeat of the public read-only instance."
module = "checks.core.heartbeat"
params.url = "https://firefox.settings.services.mozilla.com/v1/__heartbeat__"
... and that exposes each execution via a dedicated endpoint GET /checks/{a-project}/{a-check}.
The checks source code for our service becomes a repository of knowledge on how to operate and troubleshoot it. I decided to use Python, so that almost anybody could read or write the checks implementation.
I chose a simple async framework, aiohttp, since most of the checks will pull information from external sources and do very little computation (I/0 bound). Nothing fancy really.
And to follow the long tail of funny project names at Mozilla, I called it Poucave (/pu.kav/), french slang for «snitch».
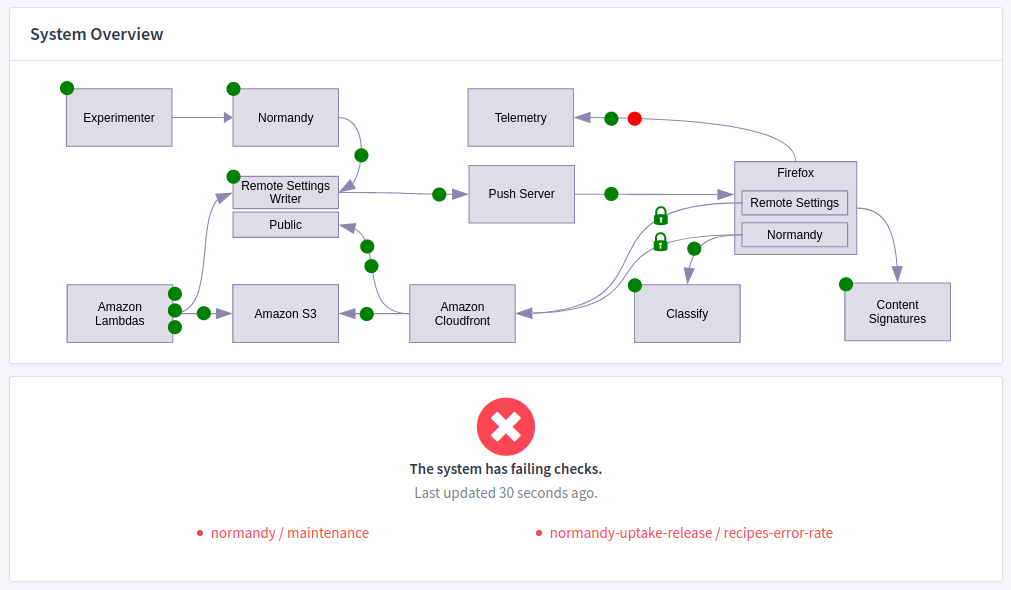
Example of live diagram. The SVG file is part of configuration.
Examples
Just to present of few of the checks that were implemented:
- checks.core.latency (generic): fails if the specified URL does not respond under a certain number of milliseconds.
- checks.core.maintenance (generic): takes a list of Github repositories as input, and fails in any of them has pull-requests who didn't receive activity in the last X days.
- checks.core.deployed_version (generic): fails while the deployed version does not match the latest tagged version on the specified Github repository.
And then, we have more domain specific checks for Remote Settings, like:
- checks.remotesettings.push_timestamp: fails if the timestamp of the published data does not match the one of our Push service
- checks.remotesettings.certification_expiration: fails if our certificates will expire soon
- checks.remotesettings.uptake_max_age: fails if the 75th percentile of clients receive only data after X seconds
- checks.remotesettings.uptake_error_rate: fails if the proportion of errors among reported statuses in Telemetry is above a certain threshold
Adding new checks is a piece of cake, even from your own packages, as long as they are available in the PYTHONPATH.
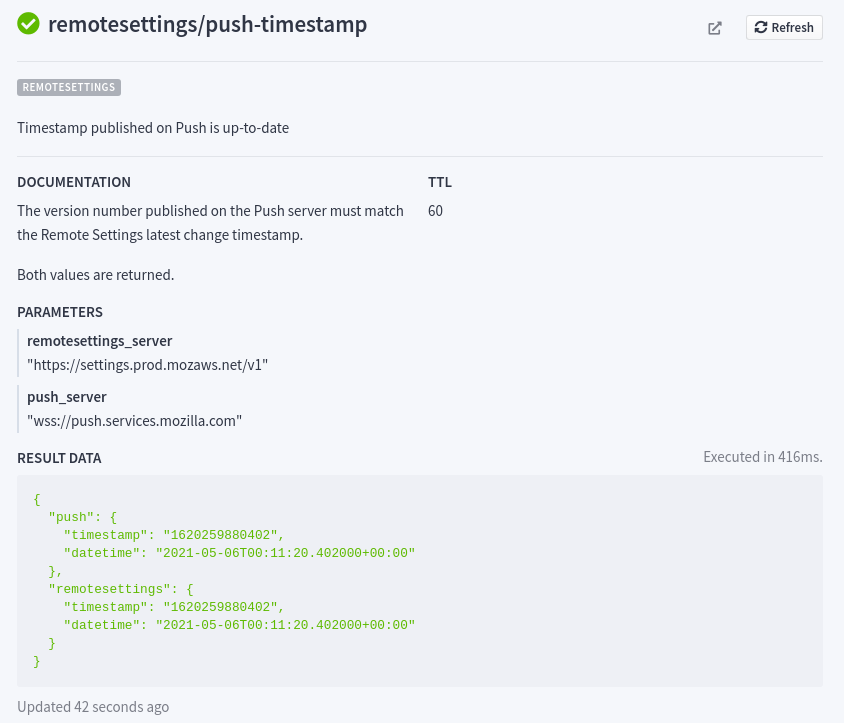
Example of check details.
Check History
If an issue in our service led twice to the same root cause, we would consider implementing a check for it.
This allowed us to consolidate the reliability of our service over time, and also build a sort of memory for it.
In order to facilitate troubleshooting, we added the ability to link each check with past issues from our Bugtracker. This way, when a check turns red, we can immediately access the history of its possible past failures, and read the related conversations and resolutions.
For checks that return discrete values, like latency or age, we also wanted to track variations over time. Because this monitoring service had to remain simple, stupid, and reliable, I wanted to avoid introducing a storage dependency.
All our applications output their logs to stdout as JSON. These application logs are then parsed and ingested elsewhere, so that we can plot them in Grafana. I decided to reuse that. Each check execution is logged, and can be presented in charts on dashboards.
It was sometimes annoying to open Grafana just to take a look at a check recent behaviour. So we added the ability to see the history of a check directly in the UI. We came up with something super simple, the server pulls the last entries from the log database, returns them as JSON, and the UI plots them in a basic chart. For more advanced charts and querying, Grafana will always be better of course.
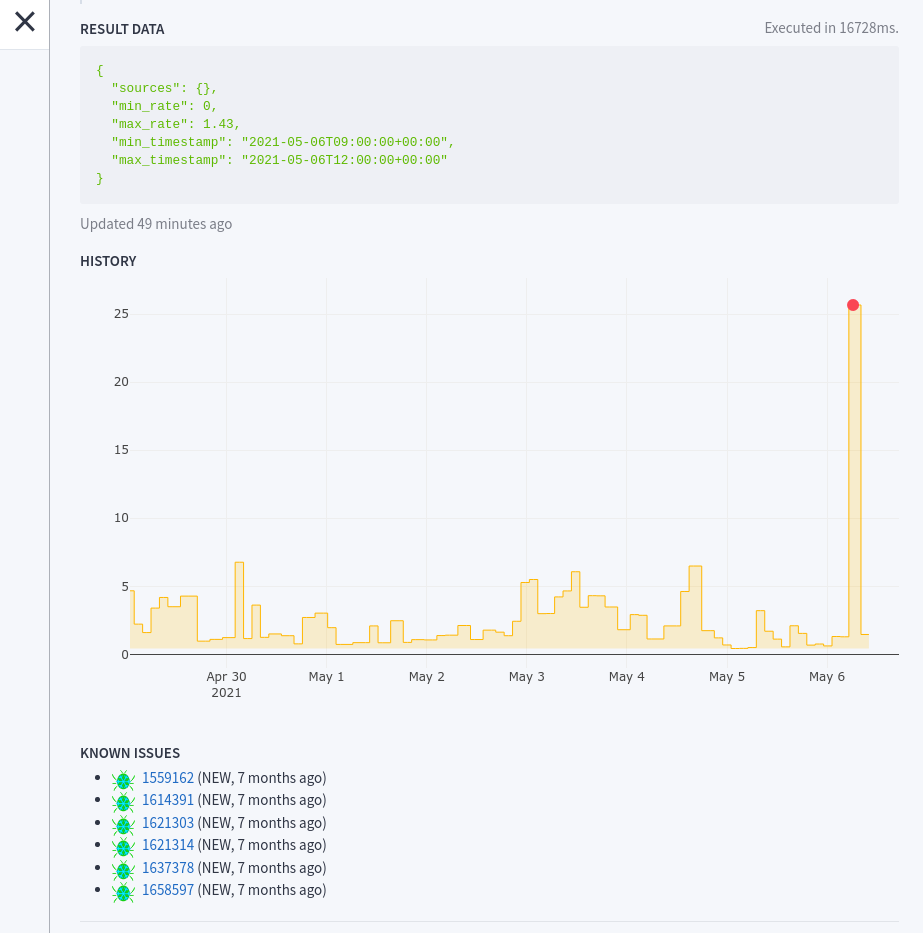
Check history with linked bugs and graph of past values.
After a few months...
This checks platform has served us very well!
Only a small fraction of checks are monitored, and only the crucial ones wake our SREs at night.
We still have false positives, notably on Telemetry. With help from our data science team, our queries and normalizations could certainly be improved.
We had one major false negative. Fortunately the issue was raised by another system. We improved the check and now feel better.
To conclude, I know with certainty that this little healthcheck application, with the live diagram, has changed the way we see and understand our services. Compared to linear problem solving, system thinking is complex. Seeing things as a whole and being able to understand interdependance and causal loops is really helpful. Everyone can now see all the moving pieces in one place, and can be reasonably reassured that the service is working well if checks are green, which also makes customer care easier for us.
In addition to this success, several teams expressed their interest in adding their own checks or running their instance for their service :) If you too are interested in using it in your organization, go on! Nothing is hard-coded and adding your own checks and SVG diagram is fairly easy! Don't hesitate to get in touch of course.
#mozilla, #opensource - Posted in the Dev category